Introduction to Kubernetes Observability in Cloud Native
Kubernetes observability in cloud-native computing is part art, part science. It is the process of making a system’s inner workings visible to engineers and operators so that they can make rapid assessments about its status. For example: are we operating under normal conditions, pushing the “red line,” or completely maxed out? The system in question could be anything from a car (think about the oil temperature, check engine, or RPM indicators on your dashboard), to a nuclear power plant, to NASA mission control (“flight path nominal” vs “Houston, we have a problem”), or anything in between.
This article will delve into the topic of kubernetes observability, its principles and applications, and some of the tools available to monitor and manage kubernetes environments.
Why is Kubernetes Observability so hard?
Since the beginning of Kubernetes, observability has been a challenge.
The first reason is that applications using Kubernetes are generally composed of microservices, where the whole application is segmented into various parts that then work together. This can make it confusing to try and make sense of it all, with lots of noise coming from every direction. And that’s just the application - Kubernetes itself is composed of layer upon layer of abstractions and services, so combining microservices with the architecture of Kubernetes itself is a huge challenge. We are talking about millions of metrics per day - so what do you focus on?
The second reason is that Kubernetes is ephemeral, workloads last on average for less than 5 minutes, so there is a timing element that needs to be factored in. It is highly possible that all the data for an ephemeral workload may disappear, and once it’s gone, it’s gone. This makes observability challenging.
Luckily, at this point, after years of teams using tools, there are great options for observability moving forward.
The Three Pillars of Kubernetes Observability
Observability makes use of three types of data points that we should define:
- Metrics: Point-in-time snapshots capturing resource consumption or system performance like CPU usage or network latency. These can often be aggregated to tell a story of the system’s performance over time or its total resource usage.
- Logs: Records of individual, isolated events occurring on the system, like sequences of discrete API calls or records of user authentication events. These are critical for troubleshooting issues.
- Traces: Detailed data about sequences of related events, such as a timeline of network calls for loading a webpage or a function/call stack trace (very useful for debugging complex kubernetes operations).
Tailoring Observability to Kubernetes Roles
When designing observability for Kubernetes, it must be tailored to different roles. The question to ask is, “What does a Kubernetes engineer or operator need to be able to see?” This obviously depends to a large extent on who the operator is. Platform engineers, for example, may be concerned most with resource consumption rates across the cluster and Kubernetes API errors. Application developers may be most concerned with errors within their own applications, especially around deployment failures.Kubernetes security engineers look for potential weaknesses we can shore up and signs of attack or compromise we need to investigate and respond to. In this article, we will consider ways Kubernetes observability data can be used to spot both.
Identifying Kubernetes Vulnerabilities Using Observability
Weaknesses, aka vulnerabilities or misconfigurations, can be spotted a variety of ways including through static code analysis or scanning a cluster. Those kinds of methods can tell you about misconfigurations that follow certain well known patterns, and they are helpful in establishing a baseline of appropriate cluster configuration. Let’s look at a different way of detecting potential misconfigurations — comparing expected behavior with actual behavior using observability data.
Examples of Vulnerability Identification Using Observability Data
The essence of identifying Kubernetes vulnerabilities via observability data is to take actual usage data from the cluster and use that to baseline “normal” behavior. That baseline can then be compared against what is permissible or possible according to the cluster’s configurations. The delta between the two reveals potential misconfigurations.
Baselining User Behavior in RBAC Auditing
In RBAC auditing, a user is assigned a certain set of roles within the cluster, granting that user the permissions associated with those roles. By baselining the user’s behavior with observability data, you can detect how many of those permissions are actually used on a regular basis. The delta between what is regularly used and what is allowed in the user’s roles represents a potential over-provisioning of the user’s permissions. Using this data to tighten the user’s permissions over time increases your adherence to the Principle of Least Privilege and reduces the possible attack surface of your cluster.
Baselining Network Traffic Via Analysis
By baselining the network traffic within the cluster, you can detect which applications and services actually need to connect to one another. The delta between which applications regularly communicate and which applications they theoretically could communicate with, given the cluster’s network policies, represents a potential misconfiguration in access control within the cluster. This can be used to define more granular networking policies, limiting the potential blast radius for an attacker to gain control of an application.
How would you observe either of these baselines? Your most likely source is cluster and application logging data. By tracking the APIs called in cluster logs on a per-user basis or the endpoints requested in network logs on a per-applications basis, you can build a picture for each of these baselines and identify rare calls/connections that might constitute anomalies (more on that in a minute). You might also get some help from metrics on bandwidth consumption or network response times, which may add some weight to the analysis gleaned from your logging.
Spotting Possible Kubernetes Attacks Through Observability Data
Signs of Kubernetes attack are sometimes referred to as “indicators of compromise” or IoCs. However, most formal IoCs are artifacts collected after a successful attack. That means, by the time you’ve spotted those in your environment, it may be too late. Observability data can help you spot suspicious behavior before a successful attack is sprung, potentially giving you time to react.
While careful and methodical attackers may attempt to be as “quiet” on the system as possible, almost every attacker will (eventually) want to try something the system wasn’t necessarily intended to do. An attacker might issue a new command, make a change to a system’s permission structure, open a new network connection, or move data around. Those moments where an attacker attempts to try something new or test the limits of the system are the moments you can use observability data to spot them. A securely architected kubernetes operation will force these moments to happen early and often, giving you more opportunities to see an adversary before they can do real harm.
Examples of Kubernetes Attacks That Can Be Identified Through Observability Data
RBAC Errors
If a production cluster is returning a “Permission Denied” error, there are only three possibilities:
- Someone is trying to do something by hand (not using GitOps in production? shame, shame)
- Something has been significantly misconfigured (which, you’ll want to diagnose and fix), or
- You’re being attacked.
If you are following our recommended best practices for a securely architected Kubernetes cluster, you should be deploying applications with their own designated service accounts and granting users and service accounts narrowly scoped RBAC permissions. Additionally, your applications should run as non-root users/processes in unprivileged containers. The combined result of these measures is that an attacker who has compromised an application in your cluster should have only a narrow set of permissions at their disposal. This is a little bit like booby-trapping your cluster a la Home Alone: now every new resource an attacker attempts to access or command they attempt to issue has an increased likelihood of resulting in a “Permission Denied” type error. Defenders can stream these errors via their observability solution of choice and see what rolls in.
Networking Anomalies
We talked earlier about baselining the network traffic within your cluster. This is beneficial beyond helping you design more secure networking policies. It also gives you a way to spot anomalous interactions. If two services in your cluster have never spoken to one another, when they suddenly start talking it might be worth listening in. Similarly, if a pod in your cluster makes an unusual request to an external resource, you might want to investigate that. These sorts of anomalies are only visible if you are actively observing what’s happening on your cluster’s network and have done enough baselining to know when something is unusual.
Novel Deployments or Commands
Observability data should make it relatively easy to spot when an application has been deployed in your cluster for the first time. That may not be a security issue— it could be a new application being rolled out or a test of something from one of your engineering teams— but its worth knowing when new things are showing up so you have the option of validating them as legitimate activity or not. Similarly, novel behaviors within workloads can be spotted and monitored— for example, a command running in a container that’s never been seen before.
For each of these scenarios, logs are the most likely source of the observability data you need to spot errors and anomalies. Trace data may help diagnose errors and determine if they are security related or due to a bug in one of your deployed applications. And, again, metrics may be helpful for assigning the appropriate weight to detected anomalies— for example: was that anomalous network connection a single packet responding to a stray probe, or was it a large amount of data leaving your system?
Other Areas to Watch
It’s important to remember that a Kubernetes cluster is an abstraction over a number of underlying compute, storage, and networking resources. Most of the scenarios we have considered above assume misconfigurations or malicious activity happening at the cluster or application layers of abstraction, but many attackers will seek to actually break free of the cluster and move down to the raw infrastructure that underlies it. This is why it’s important to harden those underlying resources, too. You should be monitoring those resources (gathering host-level logs, for example) or collecting data directly from your cloud provider. You can apply similar observability strategies to this infrastructure layer as we’ve discussed above:
- establishing baselines for auditing your architecture and configurations
- watching for certain interesting errors
- monitoring for anomalies
This host or infrastructure layer data is an important supplement to what you are seeing from the cluster itself.
Kubernetes Observability Tools
While Kubernetes itself does have the Kubernetes dashboard, and built-in features that help with observability (recent Kubernetes versions have also focused on features that make observability easier out of the box), there are many other tools that have come into the ecosystem in order to make up for the limitations in Kubernetes itself around observability.
The Kubernetes observability ecosystem is composed of pure observability tools, storage databases, visualization tools and cost monitoring. Here is a small sample of what is available in across both open source and commercial solutions:
Kubernetes Dashboard: Kubernetes does have a dashboard available, it provides the basics around CPU, memory utilization and workload health
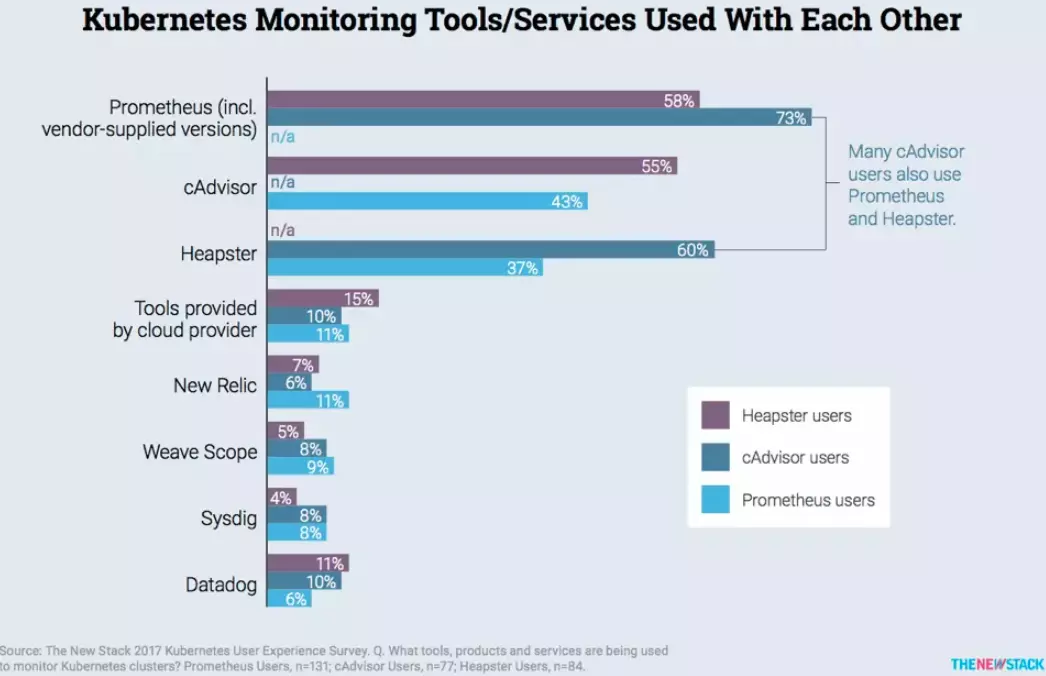
Prometheus: This is arguably the most popular open source observability and monitoring tool and has a large community of developers, despite the fact that it does not include visualizations. As a result, it is often used alongside other tools, like Grafana. It has a strong querying method and a multi-dimensional data model that is different from services that only see time-series data.
New Relic: This is a commercial option for Kubernetes observability that will provide most everything except for cost monitoring.
Kubecost: This solution provides cost monitoring for Kubernetes, and has free plus commercial offerings.
cAdvisor: cAdvisor is similar to Prometheus, in that it is Kubernetes native, and is one of the often cited observability platforms by the Kubernetes open source documentation. It doesn’t store long-term data like Prometheus and is focused on CPU, memory usage and network activity at the node level (vs pod).
Grafana: This is an open source visualization tool, made for metrics, traces and logs, it has some log browsing and supports Elasticsearch
InfluxDB: This is a time series database that allows observability metrics to be stored and queried. It’s not an observability tool in and of itself, but is a key part of the ecosystem and works especially well with Grafana.
Other solutions include DataDog, Dynatrace, Sematext, ContainIQ and more.
Conclusion
Observability is the art and science of using metrics, logs, and traces to represent the health status of a system to its engineers and operators. Kubernetes security engineers can benefit from observability in two main ways:
- By using observability data to baseline “normal” behavior in their clusters (for example, normal user API call usage or normal networking activity) and then comparing that to the cluster’s configuration, Kubernetes security engineers can spot potential misconfigurations in the form of over-provisioning of permissions.
- By combining observability data of errors and anomalies with a robust security architecture, security engineers can give themselves an early warning system of potential malicious activity.
Even the most careful attacker will encounter some errors as they bump against the permission structure in a well architected and secured kubernetes system. In a Kubernetes cluster, the kind of anomalous errors you might be looking for include errors stemming from cluster authentication/authorization systems, anomalous networking connections, and errors or unusual commands within containers.